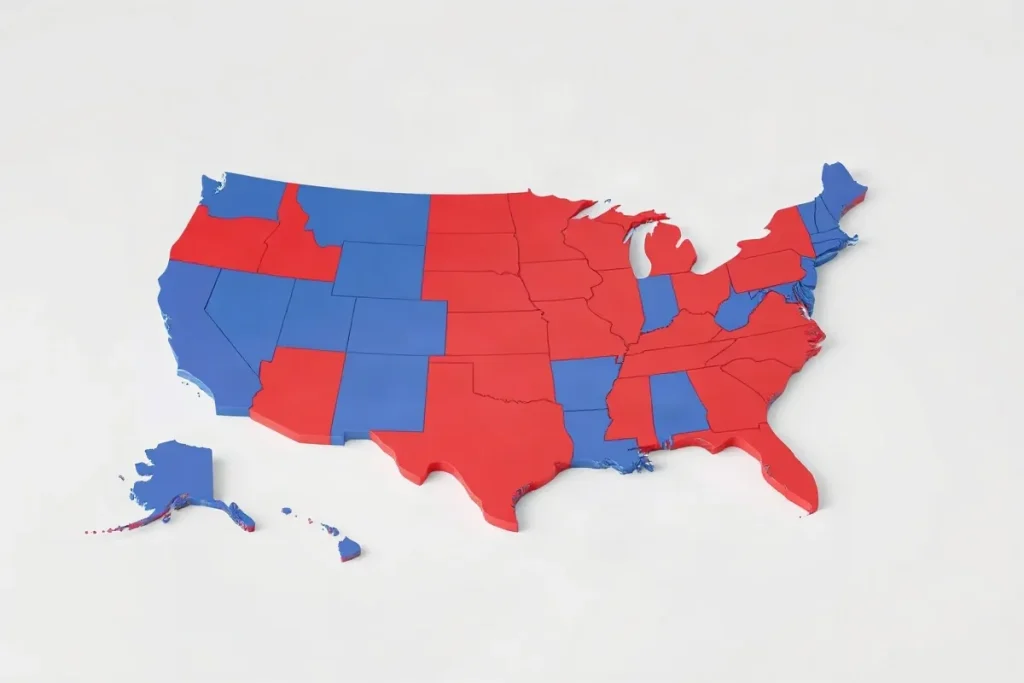
To read the U.S. political map, identify what each color represents, then check the state or district results and the election year. A map shows who won where; it does not, by itself, explain why.
The U.S. political map can depict presidential results, congressional districts, or party control of state government—and each answers a different question. Before drawing conclusions, check the map’s legend, boundaries, and date. A single national color pattern can hide close contests and differences within states.
| Map view | What it shows | What to check |
|---|---|---|
| Congressional district map | Party control of individual U.S. House seats | District boundaries and whether they are current |
| Statewide election map | The result across a state | Whether the map shows votes or seats |
| State and local map | Control of offices below the federal level | Which office and election are represented |
| Redistricting map | The boundaries used to allocate representation | Whether a court has ordered or imposed a change |
- 36 of the 40 midcycle redistricting changes since 1970 Changes made in response to a court order or imposed by a court
- 17 of Texas’ 32 U.S. House seats Seats won by Democrats in 2003
- 15 of New York’s 26 U.S. House seats Seats won by Democrats in 2003
- 25 Republicans and 12 Democrats Current Texas U.S. House delegation described by Pew Research Center
Why is a U.S. political map more than a red-blue election map?
A U.S. political map shows which party controls a particular office or area at a particular moment; it does not permanently describe the voters who live there. The colors depend on what was measured and when.
A federal election result can differ from state and local control in the same place. A state’s congressional delegation, its governor’s office and its local government are separate contests, so a map of one cannot stand in for the others.
Check the office and boundary
- Congressional district map: Each color represents the result or control for a particular House district, not the state as a whole. District boundaries determine which voters are grouped together.
- Statewide map: A color may represent a statewide race or control of a state office. It does not show how each congressional district voted.
- Local map: A city or county result describes that contest and boundary, not federal or statewide party control.
A red-blue map also compresses a varied political landscape into two party labels. Democratic and Republican coalitions include people with different policy views, and party positions can shift over time. Read the map’s title, office and boundary before treating its color as a description of a place.
How do district lines turn votes into seats?
U.S. House district lines turn votes into seats by letting the candidate with the most votes in each district win its single seat, even when the losing candidate has substantial support.
That winner-take-all rule applies district by district, not across a state. A party can win every House seat in a state without winning every vote cast there, so a statewide seat count does not necessarily mirror the electorate.
Read Massachusetts by district and statewide
Massachusetts shows the difference: Democrats hold all nine U.S. House seats, while Republicans reliably receive support from a third of the state. To understand how that support translates into representation, compare the statewide vote with the results in each district rather than treating the seat count as a measure of every voter’s choice.
Why can a district map change between censuses?
Congressional district maps can change between censuses when courts order a redraw or impose a new map. Redistricting is not always a once-per-decade event.
Court changes and state examples
Pew Research Center says 36 of the 40 midcycle redistricting changes since 1970 were made in response to a court order (20) or imposed by a court itself (16). Court action is therefore a central reason maps have changed between censuses.
- Texas: In 2003, Democrats won 17 of Texas’ 32 U.S. House seats. The current delegation described by Pew Research Center is 25 Republicans and 12 Democrats.
- New York: In 2003, Democrats won 15 of New York’s 26 U.S. House seats.
These state results are snapshots from different points in time, not a like-for-like measure of how voters have changed. When comparing maps, check the election year and whether a court action changed the districts between elections.
What do party colors leave out about voters and policy?
Party colors show which party won an election, not whether every voter in that state agrees with its positions or how much support each position has.
The Republican and Democratic Parties dominate national politics, but their policy positions have moved farther apart over the last 30 years: Democrats have moved left, while Republicans have moved right. As voters increasingly align their beliefs with their party’s positions, a state’s color can reflect partisan sorting as well as competition for office. It cannot show the range of views among voters who backed the same party.
What shapes the map besides opinion?
Campaign finance rules affect which candidates can raise support and compete. Donors may have more influence over candidate selection when rules make it easier to give large amounts. A winning party’s control of seats can also differ from its share of public support: under winner-take-all rules, a party can take every seat in a district without winning every voter.
Before treating a colored map as a measure of public opinion, check the specific election, its campaign finance rules and how votes translated into seats.
When does the usual red-blue reading fail?
The red-blue reading fails when a statewide result is treated as a verdict on every race, every voter, or every policy. A state’s presidential result does not tell you who won its House districts, state offices, or local contests; check the office and district before drawing conclusions.
A party’s seat majority also does not necessarily mean most voters supported it. Under winner-take-all rules, a candidate can take a district’s representation without winning a majority of its votes. Massachusetts illustrates the gap: Republicans reliably receive about a third of the vote, while Democrats hold all nine U.S. House seats.
Check the boundaries and the candidates
- District lines: A court can order a new district plan, making a map temporary. Check whether the boundaries in use are final before comparing districts or interpreting a seat result.
- Local races and policy: Party colors can conceal differences among candidates and variation within a state. A map alone cannot tell you what a particular officeholder supports; check the candidates and the office at stake.
Frequently asked questions
What does a U.S. political map show?
Why can a party win every seat without winning every vote?
Can congressional district maps change between censuses?
Does a red or blue state mean all its voters share one party’s views?
Sources
- facinghistory.org — “Political Polarization in the United States”
- protectdemocracy.org — “Proportional representation, explained”
- Pew Research Center — “How often are congressional districts redrawn between censuses?”